Where Do People Have Problems With Financial Services?
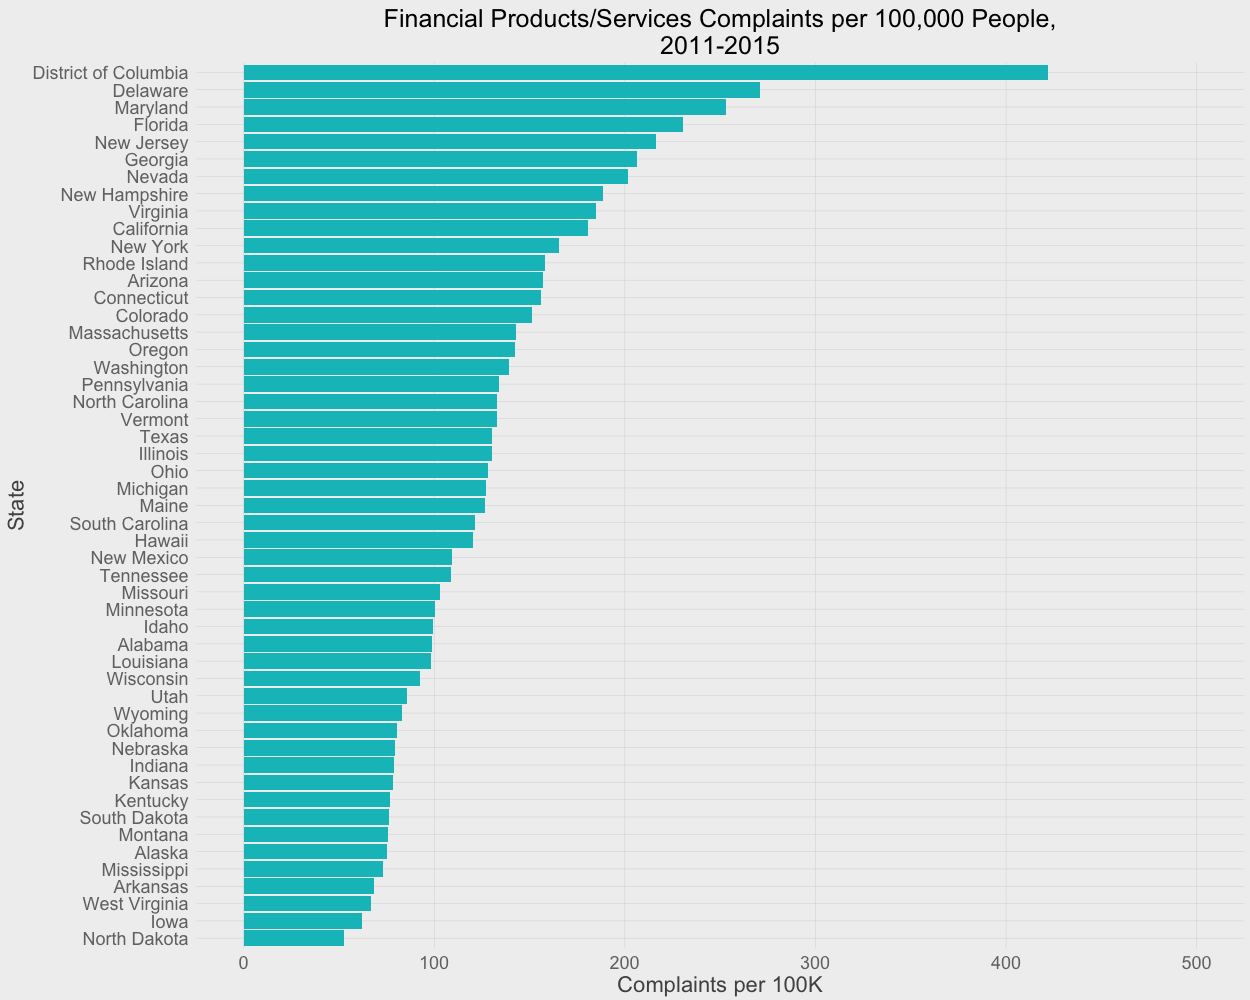
A while ago, I was curious if people have more issues with financial services and products in some states than in others. Given the recent Wells Fargo scandal, I figured I’d post the results. Though this doesn’t get at the reasons people complain more in some states, it’s still pretty interesting.

For those interested, the R code to create this chart from the CFPB Complaints data can be found in the Github repository for this post.
